By: Emily Kuzan
Support for President Trump drops as COVID-19 national emergency declared
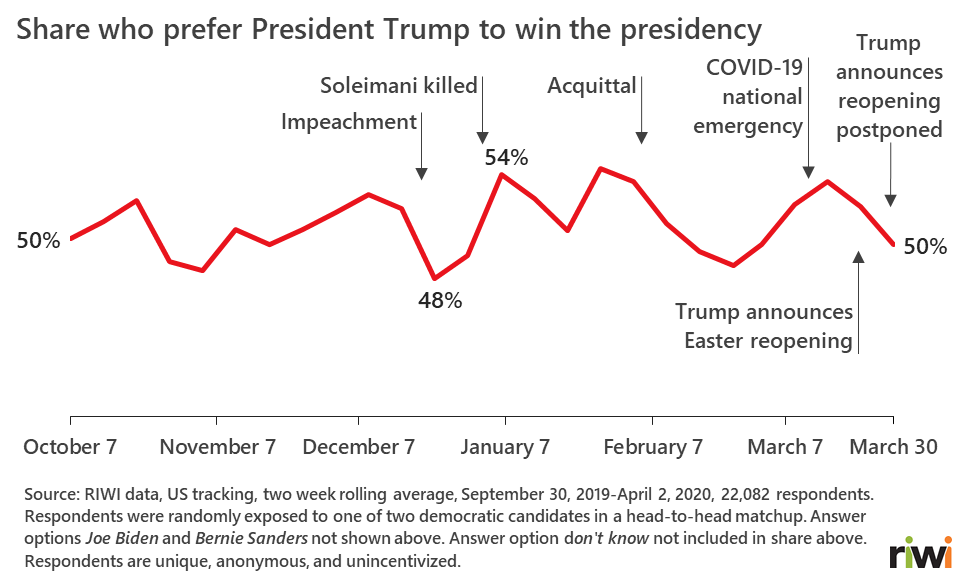
In the midst of the COVID-19 pandemic, RIWI data show support for President Trump is trending downwards. By contrast, FiveThirtyEight’s polling aggregate indicates President Trump’s approval rating has increased by nearly four percentage points since mid-March to 46 percent. The drop comes from three of the four major regions in the US (Midwest, Northeast, and West). RIWI data show that support remained relatively stable in the South at 52 percent. The drop in the Midwest, a swing region instrumental to President Trump’s 2016 win, which RIWI predicted, is particularly notable as support had previously remained unaffected through significant events this winter.
Election outcome still unclear, say over 9,000 RIWI crowd predictors in March
| Regardless of whom you support, which party do you think will win your state in the 2020 Presidential election? | ||
| Democratic Party | Republican Party | Don’t know |
| 25% | 24% | 51% |
| Source: RIWI data, US tracking, March 1-31, 2020, 9,077 respondents. Respondents are unique, anonymous, and unincentivized. |
||
- Both academic research and previous RIWI predictions show that asking who respondents think will win is more predictive than tallying individual preferences.
- This month the Democratic party continues to narrowly edge out the Republican party while the share of don’t know increased since last month.
- Similarly, among those who believe it is worth their time to vote, don’t know has increased four percentage points, to 30 percent. Among likely voters, the Democratic and Republican parties are currently tied at 35 percent.
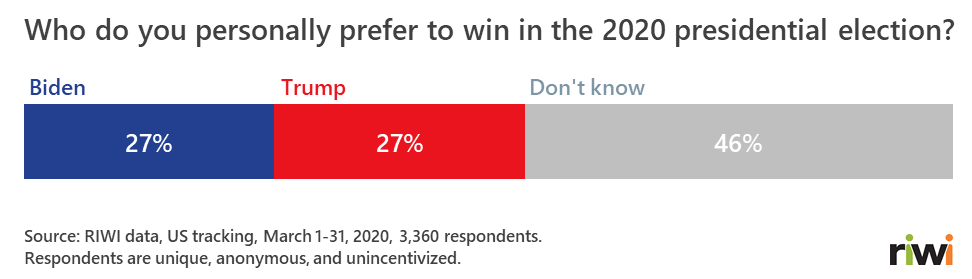
Former Vice President Biden and President Trump tied in a head-to-head matchup
Two candidates remain in the race, but with a significant delegate lead over Senator Sanders, Former Vice President Joe Biden is now the likely Democratic nominee for November’s Presidential race. When Former Vice President Biden goes up against President Trump, the two candidates are tied at 27 percent with 46 percent of respondents still undecided on which they would prefer to win the election.
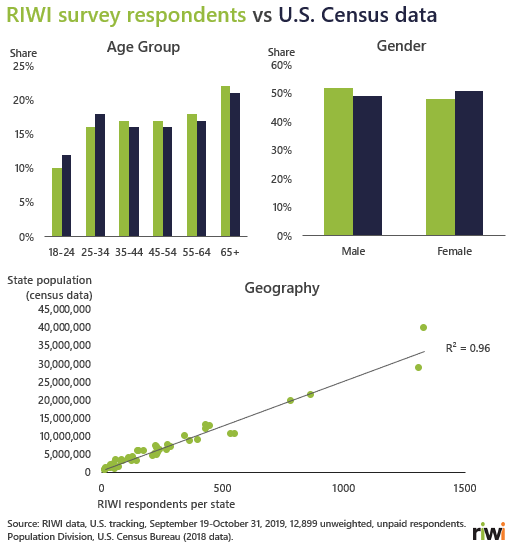
In this study, RIWI’s unweighted survey data nearly match U.S. census data when comparing age, gender, and geographic distribution (as highlighted in our first monthly update).
About 2020 In-Focus: RIWI Predictive Election Tracker
RIWI’s data collection is unique because it:
- Uses patented technology that accurately predicted the 2016 Presidential Election
- It is continuous and real-time
- It reflects both engaged and politically disengaged populations, in contrast to traditional polls which typically capture engaged, often paid, populations
- It reflects views anonymously, reducing social desirability bias
- It uses unincentivized respondents who are not on a ‘panel’ of habitual survey takers, receive no money or rewards-in-kind for participating in the survey, thus ensuring data quality, anonymity and compliance with privacy law.
Two of the “X-factors” that caused conventional polls to miss the 2016 election and that could manifest again in 2020 were 1) the underreflection of typically disengaged populations including those in the Midwest and 2) the “shy Trump voter” effect1. The RIWI patented methodology and technology platform addresses both X-factors.
From October 2019 to the November 2020 election, expect monthly updates on which party Americans think will win the Presidential Election, who Americans personally prefer to win the Presidential Election, and a new monthly insight depending on what the data reveal.
- Russonello, G. (2019, November 23). Four Problems With 2016 Trump Polling That Could Play Out Again in 2020. The New York Times. Retrieved from https://www.nytimes.com/2019/11/23/us/politics/2020-trump-presidential-polls.html