By Danielle Goldfarb
Does China’s demographic decline mean the country has reached “peak housing”? Will official Chinese data accurately reflect the extent of the housing cycle? A housing cycle can be a leading indicator of a slowdown, with implications for growth of the Chinese and global economy.
Because RIWI’s technology allows access to randomly engaged respondents throughout all parts of China including all city tiers, we can use it to gain both a broad-based perspective as well as a more granular view of Chinese housing price dynamics. We have been asking a suite of economic and equities related questions in China on an ongoing basis, and in January 2021 we added questions on housing price changes and affordability. Each month, we randomly engage about 2,000 unique respondents from across all cities and regions of China. Each month, we hear from a unique random cohort.
Economist Mark Kruger has analyzed the first 6 months of RIWI data on housing prices (January to June 2021) and finds something not reflected in existing data sources. His analysis suggests more nuance to the housing price story: strong demand for better apartments may be a source of strength in China’s housing market for some time to come.
“In order to get a more nuanced picture of home price dynamics, we turn to data collected by RIWI (www.riwi.com), which uses patented, machine-learning technology to reach the broadest possible set of respondents by continuously drawing in populations otherwise not included in surveys.
In China, anyone using the Web could be randomly exposed to a RIWI survey. The vast majority of RIWI’s Chinese respondents have never or rarely taken surveys before. Typically, Chinese surveys only draw on those living in key urban centres and on habitual, incentivized survey respondents. Or they use content drawn from social media. RIWI’s surveys are anonymous, continuous, random and do not collect personally identifiable information, increasing the likelihood that respondents will answer authentically.
Between January and June 2021 (and ongoing), we used RIWI technology to randomly engage respondents from China’s Web-using population to answer questions about their economic behavior, including how the value of their homes had changed over the past 12 months. The resulting data were gathered 24/7 and on a continuous basis. The responses came from all over China, including all tiers of cities. RIWI’s respondents are un-incentivized. They answer the survey because the questions seem interesting.
Based on close to 11,000 responses, the RIWI data show an average home price increase of 5.5 percent for the period January-May. This compares to 4.0 percent for the China Index Academy. RIWI respondents likely reported the change in their existing homes, while the China Index Academy’s 100-city data covers new-home prices.
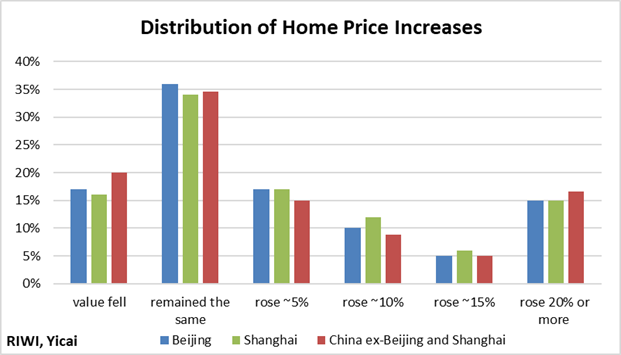
We sorted the sample into six groups by home-price change: those whose prices fell, those that remained the same, and those whose prices rose by 5, 10, 15 or 20 percent and more. We also divided the respondents into three regions: Beijing, Shanghai and everywhere else in China.
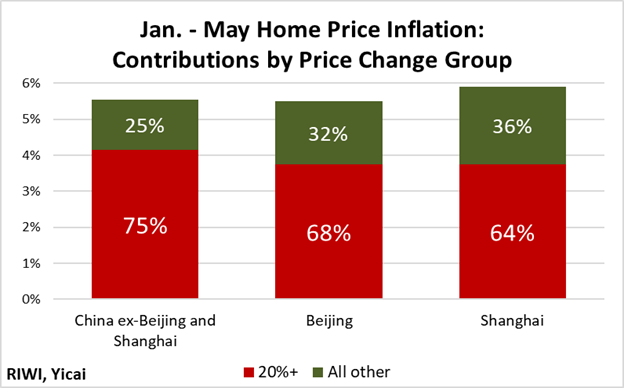
The distribution of the price groups was strikingly similar across all three regions. This suggests that price dynamics are driven by intra- rather than inter-regional factors. Most of the responses cluster around a zero price change. However, the distribution has a “fat tail” with 15 percent of respondents reporting a price change of 20 percent or more.
We estimate that the properties in the fat tail had an outsized influence on the aggregate price change. This relatively small group contributed 64 percent to the price increase in Shanghai, 68 percent to the price increase in Beijing and it accounted for three-quarters of the price increase elsewhere in China.
The RIWI data imply the price pressures we are seeing are narrowly based in a relatively small share of properties. What do we know about the people who own these homes?
It turns out that their owners earn higher incomes, are better educated and are more likely to own their own companies than those in the rest of the sample. From these characteristics, we can assume that they live in better housing. The relatively rapid increase in the price of better housing suggests that the demand for upgrades is what’s driving home price inflation.
This is not surprising. Many Chinese apartments are small. Relatively few have elevators, with the six-floor walk up being a popular configuration. And there is a strong demand for apartments in good school catchment areas, which sell at premium prices. With the strong increase in incomes in recent years, it is understandable that Chinese families are willing and able to spend more on housing.
If the demand for upgrades is driving home price inflation, there are implications for policy as well. Implementing broad-based measures may be inappropriate should the authorities want to manage rising price pressures. Instead, they may want to focus more narrowly on policies which increase the supply of and reduce the demand for higher-end real estate.
For many observers, China’s demographic decline means that the country has already reached “peak housing”. However, the implication of the granular data provided by RIWI’s surveys is that the demand for upgrades could be a source of strength for years to come.”
For more, see Mark’s original article “How Should We Think About Rising Home Prices?”.
Study of the RIWI China housing price dynamics data-stream is ongoing and data collection continues daily. Please be in touch with us at ask@riwi.com for more information about the data or to access/analyze the data.