By: Danielle Goldfarb and Emily Kuzan
Data are current as of April 30, 2020 at 23:59 Eastern Daylight Time (EDT).
RIWI real-time income loss data in the US, Canada, UK, and China from over 12,000 respondents over the last two weeks of April show that things are much worse than the employment numbers suggest, and consistently so.
The latest releases of official jobs data in Canada and the US show substantial job losses. These official data provide a rear-view mirror, reflecting what happened weeks ago, at the outset of physical distancing measures in North America. When the next official jobs data are released on May 8 they will still lag reality by weeks, reflecting what happened by mid-April1. In the UK, jobs data lag reality by months, with the latest official data from February, not at all reflecting the economic shutdown period that began in March.
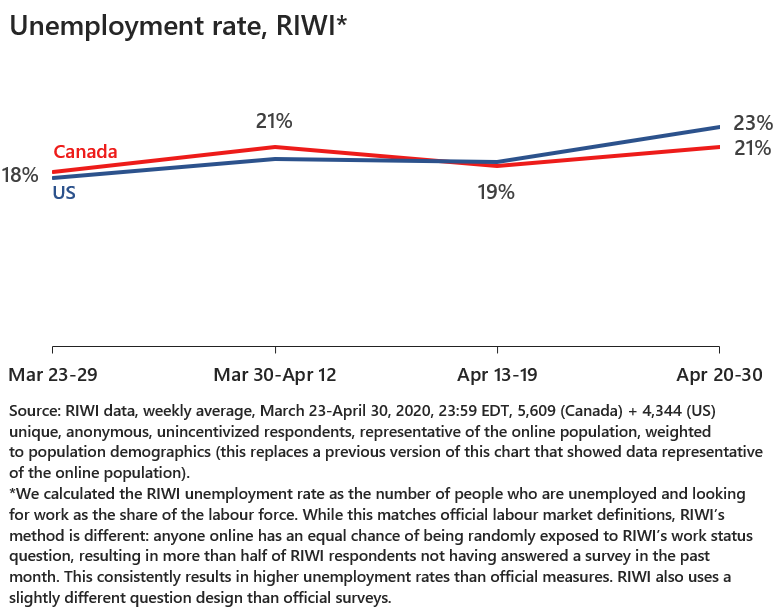
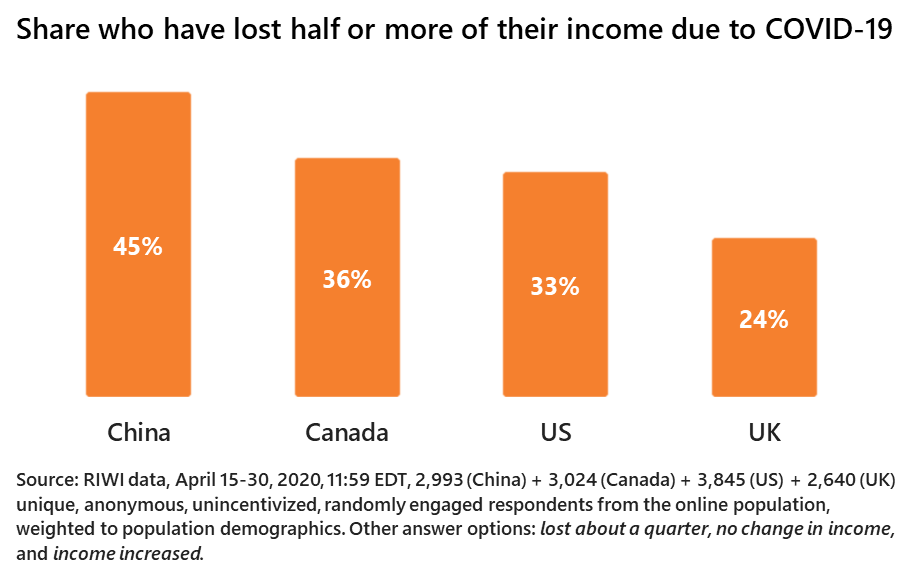
Much has happened in these last few weeks missed by these lagged data. RIWI real-time data from the last two weeks of April show the bad news that things are much worse, and consistently so. One in five Americans and Canadians who want jobs do not have them. Worse: one in three has lost half or more of their income due to COVID-19. Young Canadians have been particularly hard hit both in terms of income loss and unemployment. Brits are also facing significant unemployment and income loss. And Chinese citizens, now ahead of the rest of the world on the reopening front, report more significant income losses, a possible harbinger for the rest of us. The income loss data in all four countries show that things are worse than the official overall employment numbers suggest.
| Unemployment rate and income loss, RIWI data and official data | ||||
| Canada | China | UK | US | |
| Lost half or more of income due to COVID, RIWI (%) April 15-30, 2020 |
36 | 45 | 24 | 33 |
| Unemployment rate2, RIWI (%) April 15-30, 2020 |
20 | 16 | 15 | 22 |
| Unemployment rate, official (%) [latest survey period] |
7.8 [March 14-21, 2020] |
5.9 [March 2020] |
4.0 [February 2020] |
4.4 [March 8-14, 2020] |
| Source: Latest official labour market statistics; RIWI data (April 15-April 30, 2020, 23:59 EDT, 2,511 (Canada) + 1,465 (China) + 2,143 (UK) + 2,646 (US) unique, anonymous, unincentivized respondents, randomly engaged from the online population, weighted to general population demographics). | ||||
Each day, RIWI asked a new set of randomly engaged citizens about their job and income status. We inquired about income loss as well as job loss, which standard official jobs data do not cover in these countries or elsewhere. This detail is particularly relevant for people working for multiple employers or gig workers.
The share of those who have lost half or more of their income remained relatively consistent each day, even with a new set of randomly engaged citizens each day. The share reporting they were unemployed rose in late April compared with late March. These numbers are consistent with the share of those who don’t have jobs in a new paper using bi-weekly survey data in the US.
The consistently alarming numbers of unemployed and those with significant income losses amongst new respondent groups every day suggest a very significant impact during this phase of the outbreak. RIWI data from about 3,000 randomly engaged Canadians and 3,000 randomly engaged Americans over April 15-30 also show that the majority would spend cash support on basic needs, rather than save it or spend on discretionary items. Citizens have few resources to fall back on.
Overall, it is clear from the RIWI income loss data in all four countries that things are worse than the latest official unemployment rate suggests. These income loss data suggest things are even worse than the much higher RIWI unemployment data suggests. People may still be employed but may have had their wages or hours cut. For those at the beginning of their careers, while they report unemployment at similar rates to those of the rest of the working age population, they also report more severe income losses than older workers. This is true in each of Canada, the UK, and the US. In the case of China, RIWI data show that income loss is worse amongst rural populations, in line with migrant workers no longer working in the cities.
| RIWI unemployment rate and income loss, April 15-30, 2020, total and ages 25-34 | ||||
| Canada | China | UK | US | |
| RIWI data (April 15-30, 2020) | ||||
| Lost half or more of income due to COVID (%) – total | 36 | 45 | 24 | 33 |
| Lost half or more of income due to COVID (%) – ages 25-34 | 44 | 44 | 28 | 43 |
| Unemployment rate3 (%) – total | 20 | 16 | 15 | 23 |
| Unemployment rate (%) – ages 25-34 | 23 | 12 | 16 | 23 |
| Source: RIWI data, April 15-April 30, 2020, 23:59 EDT, 2,511 (Canada) + 1,465 (China) + 2,143 (UK) + 2,646 (US) unique, anonymous, unincentivized respondents, randomly engaged from the online population, weighted to general population demographics (this replaces a previous version of this table that showed unemployment rate representative of the online population). | ||||
What will happen now? Will government income support kick in and mitigate the impacts? When governments allow factories and restaurants and offices and schools to reopen, will people go? Will workers be rehired quickly? Will citizens save more? Go out less? Travel less frequently?
Behavioural fear is the ‘X-factor’ in any crisis. Its presence or absence is impossible to model in forecasts without real-time data. People behave in unexpected ways when lives and earnings hang in the balance. Anxieties can trigger or immobilize action. Concerns can postpone or impede the resumption of “normal” work and leisure. At the same time, lack of concern can compound unintended consequences, too. When measuring these psychological aspects, it is critical to hear from the broadest set of voices – not just from those who are active on social media, answer traditional panel-based surveys or participate in high-profile lobbying activities.
The data in this brief are from RIWI’s high-frequency economic resilience monitor. We are measuring both the real-time jobs and income impacts as well as these psychological and consumer impacts on a daily, high-frequency basis around the world as we head into the reopening phase. As behaviour is shifting at different phases of the epidemic in each country, episodic data collection will fail to capture inflection points. Supply-side data such as traffic, pollution levels or OpenTable reservations will tell us part of the story, but little about future demand. We are, therefore, tracking anticipated demand continuously. What can different countries and policy-makers and corporations learn from other countries that are at different stages of the crisis or at different stages of re-opening their economies?
Previous RIWI economic resilience data have been widely cited during this crisis, including in these recent academic papers on US and UK Labour Markets Before and During the COVID-19 Crash and Real Time Labor Market Estimates During the 2020 Coronavirus Outbreak.
RIWI’s origins are in pandemic surveillance infodemiology during H1N1 and we are actively surveilling various aspects of the COVID-19 pandemic in multiple countries. This includes tracking the trajectory of self-reported illness and testing, trust in public officials and compliance with public health directives, and the psychological, financial, and consumer impacts.
To gather these data, we use a proven, randomized, broad-based approach. The approach has been independently and repeatedly verified as capturing a truly random sample of the Web-using population. This approach is distinct from traditional recruited panel survey methods.
During a pandemic, traditional data collection methods face heightened challenges:
- In-person interviews and focus groups are not possible during physical distancing.
- Email access panels suffer as people are overloaded with email registering as spam and phish attempts.
- The information explosion of loud voices on social media makes social media analytics full of greater noise and “echoes” and therefore provides an unreliable signal of truth.
RIWI technology addresses many of the data collection challenges that are heightened during the COVID-19 pandemic:
- RIWI draws randomly from the entire Web-using population in each country, so as more people go online, RIWI’s access broadens.
- RIWI data collection is continuous, making it possible to pinpoint inflection points no matter when they happen in any particular week or month.
- Respondents reflect both engaged and typically disengaged populations, in contrast to typical polls which tend to capture engaged, often paid, populations (more than half of RIWI respondents have not answered a survey in the past month).
- RIWI data are collected anonymously, reducing social desirability bias as compared with in-person or phone interviews, or online surveys that require sharing personally identifiable information (such as an email address).
- RIWI respondents receive no money or rewards-in-kind for participating, ensuring data quality, respondent security, anonymity and compliance with privacy laws.
For more information on this research or data set, please contact Danielle Goldfarb, Head of Global Research at daniellegoldfarb@riwi.com.
Related research:
A different type of crisis demands a different type of data
Could a fear-demic lead to an unnecessarily severe economic crisis?
Hearing from all voices during COVID-19
Are enough of us doing the right thing? Physical distancing during COVID-19
Virtual lecture: How is the public responding to COVID-19?
Chinese vs. American Confidence in COVID-19 Response Measures
- More regular, timely data on unemployment insurance claims in the US and claims for Canada’s new emergency government benefits do give us an indication of the direction and size of the impact. There has been a dramatic surge in UI claims and a dramatic takeup of the Canadian benefits. Still, claims data are an imperfect proxy for the impact and may significantly underestimate it, as a new paper shows for the US.
- We calculated the RIWI unemployment rate as the number of people who are unemployed and looking for work as the share of the labour force. While this matches official labour market definitions, RIWI’s method is different: anyone online has an equal chance of being randomly exposed to RIWI’s work status question, resulting in more than half of RIWI respondents not having answered a survey in the past month. This consistently results in higher unemployment rates than official measures. RIWI also uses a slightly different question design than official surveys.
- We calculated the RIWI unemployment rate as the number of people who are unemployed and looking for work as the share of the labour force. While this matches official labour market definitions, RIWI’s method is different: anyone online has an equal chance of being randomly exposed to RIWI’s work status question, resulting in more than half of RIWI respondents not having answered a survey in the past month. This consistently results in higher unemployment rates than official measures. RIWI also uses a slightly different question design than official surveys.