By Danielle Goldfarb and Emily Kuzan
Data current as of June 24, 2020 at 16:00 Eastern Daylight Time (EDT).
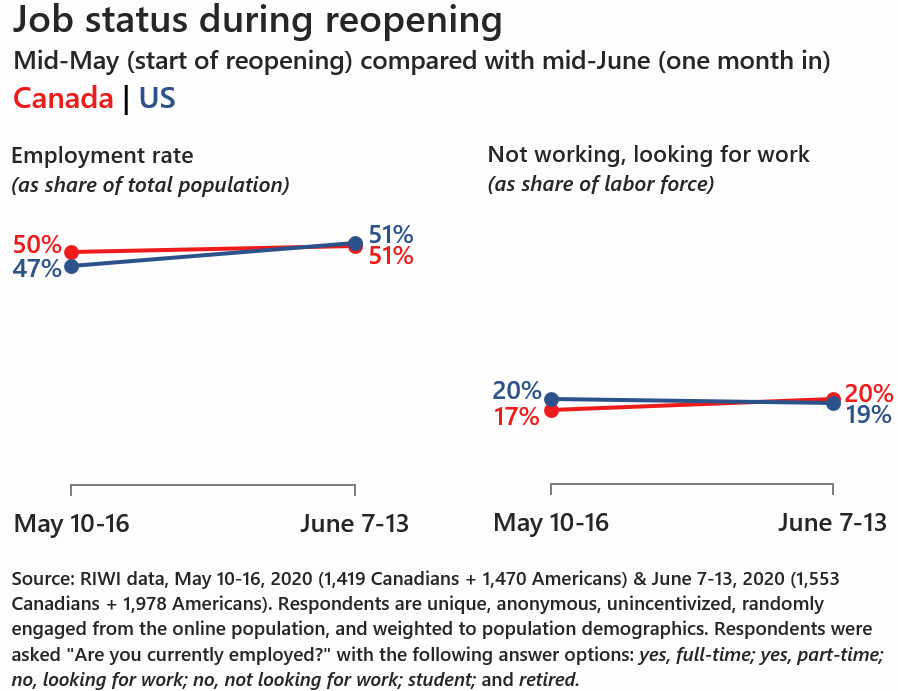
RIWI’s real-time jobs data show that between mid-May and mid-June, the employment situation barely changed in Canada, while it improved in the US. By using a method that engages the broadest swath of the population, the Canadian data do not show a surge in employment in mid-June, or even by the third week of June, compared to May. In the US, employment rates improved between mid-May and the third week of June, while the share of those looking for work remained the same. Still, almost one in five people in North America who want work don’t have jobs. This is despite more advanced reopening phases across both countries. RIWI previously showed that conditions had started to improve in both countries by mid-May – weeks in advance of it being confirmed in the June official jobs reports that surprised consensus.
How quickly is the North American economy recovering? How quickly are the many who were furloughed or laid off being rehired or finding new jobs?
The latest available official jobs data reflect the mid-May period, at the very beginning of reopening. These data surprised many experts by showing a notable improvement since the previous month. These May jobs reports released in June reflect the early reopening period, but what matters now is what happens as businesses begin to understand true demand as reopening continues or stalls. This will give us a better sense of the degree to which the economy is recovering and at what speed.
Was there another notable improvement in the employment situation since mid-May? This is what we might expect as reopening continued across the US and Canada. Official data will answer this question with a lag, when the next US and Canadian official jobs reports come out in July (July 2 in the US, July 10 in Canada), reflecting job statuses in mid-June.
RIWI data show that by mid-June, as reopening was well underway across North America, the overall picture improved, but RIWI’s Canadian jobs data are not improving at the same rate as reopening.
In Canada, employment remained stable and the share of those without jobs and looking for work grew, reflecting more people rejoining the labor force to look for work rather than a true increase in those out of work. In the US, the share of the employed population grew relative to the previous month, though the share of those looking for work did not fall much.
RIWI’s data show that, in both countries, 1 in 5 people are looking for work, a huge share of the population. By mid-June 2020, 28 percent more Canadians and 34 percent more Americans were looking for work compared with RIWI’s pre-COVID rates in mid-February 2020.
This paints a gradual picture of improvement during the first month of reopening, with many gains realized already in the pre-opening period. This aligns with data up to June 12 from the Canadian data from jobs search aggregator Indeed showing that, while new Canadian job postings are showing momentum, the total stock of job postings in Canada continues to recover only gradually. Commuter traffic volumes in major North American cities are also way down according to data from TomTom (referenced in the Deloitte economic recovery dashboard), although many are still working from home and most schools are still closed.
| Employment picture at the start of reopening (mid-May) compared with one month later (mid-June) | ||||
| US | Canada | |||
| May 10-16 | June 13-17 | May 10-16 | June 13-17 | |
| Employment rate (%), RIWI | 47 | 51 | 50 | 51 |
| Unemployment rate (%), RIWI | 20 | 19 | 17 | 20 |
| Official unemployment rate (%) | 13.3 | To be released July 2 |
13.7 |
To be released |
| Source: Bureau of Labor Statistics; Statistics Canada; RIWI data (May 10-16 2020, 1,470 (US) + 1,419 (Canada) respondents & June 13-17, 1,978 (US) + 1,553 (Canada) respondents. Respondents are unique, anonymous, unincentivized, randomly engaged from the online population, and weighted to general population demographics). | ||||
Did the situation improve in the days following the mid-June official reference week, as might be expected after one more week of reopening? RIWI’s US employment and unemployment rates during the week of June 18-24 were the same as during June 13-17. In Canada, the employment rate was similar. While the share of those Canadians who self-reported they were looking for work fell by June 18-24, this is not because more of them found jobs, it is because they said they were unemployed but not looking for work.
RIWI’s May data showed – weeks in advance of it being confirmed in official data – that employment conditions had started to improve by mid-May in both countries. The improvement in official data was a surprise relative to consensus opinion. (RIWI data has also been found in independent review and in the past to better predict divergences from the US nonfarm payroll consensus prediction of Wall Street economists than all other benchmarks (see here)).
We gathered these data using RIWI’s Random Domain Intercept Technology. RIWI randomly engages citizens in the US and Canada about their working status and other economic and financial behaviors on a continuous basis. Each day, RIWI asks a new set of randomly engaged citizens in each of Canada and the US, asked over 1400 respondents per week in each country. During the week of June 13-17 (the reference period for the official jobs reports), RIWI randomly engaged Americans and Canadians about their work status, and compared it the answers of respondents engaged during the previous reference period from May 10-16, as well as the week after the July report reference week, June 18-24.
The result of this random engagement approach is that more than half of RIWI respondents in the US and Canada have not answered a survey in the past month. Data collection took place continuously 24/7, allowing us to observe what happened at the start of lockdown and now during reopening. All of the data were collected anonymously and respondents were not incentivized.
We calculated the RIWI unemployment rate as the number of people who are unemployed and looking for work as a share of the labor force. While this matches official labor market definitions, RIWI’s method is different for two main reasons. First, anyone online has an equal chance of being randomly exposed to RIWI’s work status question, resulting in more than half of RIWI respondents not having answered a survey in the past month. Many RIWI survey takers may not respond to typical government surveys. Pre-COVID, this approach consistently resulted in higher unemployment rates and lower employment/participation rates than official measures.
Second, RIWI also uses a slightly different question design than official surveys, asking “Are you currently employed? Yes, full-time, Yes, part-time, No – I am looking for work, No – I am not looking for work, Student, Retired”. Official measures classify someone as looking for work only if they have done so actively in the past week. The RIWI question format allows anyone who considers themselves looking for work to self-report that they are doing so even if they have not scoured the job ads or applied for a job. The distinction is especially important now, since people may want to work but may not be actively looking for jobs when few jobs are available. RIWI’s measure allows them to self-report that they are looking for work.
RIWI continues to collect jobs data throughout the next phases – including reopening slowdowns in parts of the US as COVID cases surge – to allow business and public policy leaders and the general public to keep a close, advance watch of the pace and extent of recovery in North America and globally.
Related research:
US Nonfarm Payrolls Prediction using RIWI Data
What We Won’t See in this Week’s Jobs Data
COVID-19’s Income Truth: Real-time losses are worse than they appear
A different type of crisis demands a different type of data
Previous RIWI jobs and income data have been widely cited during this crisis, including in these recent academic papers on US and UK Labour Markets Before and During the COVID-19 Crash and Real Time Labor Market Estimates During the 2020 Coronavirus Outbreak.
For more information about the data in this analysis or other RIWI high-frequency data streams please contact us at ask@riwi.com.
About RIWI
RIWI stands for “real-time interactive world-wide intelligence”. We provide access to continuous consumer and citizen sentiment in all countries. RIWI breaks through the noise to find the truth about what people really think, want and observe – by reaching the most diverse audiences, including the disengaged and quiet voices who do not typically answer surveys or express their views on social media. RIWI technology rapidly collects data in every country around the world and displays the results in a secure interactive dashboard in real-time. We only collect anonymous information: 229 countries and territories, over 80 languages and 1.6 billion interviewees and counting.
RIWI’s origins are in pandemic surveillance infodemiology during H1N1 and we are actively monitoring various aspects of the COVID-19 pandemic in multiple countries in real-time. This includes tracking the trajectory of self-reported illness and testing, trust in public officials and compliance with public health directives, and the psychological, financial, and consumer impacts of the crisis.